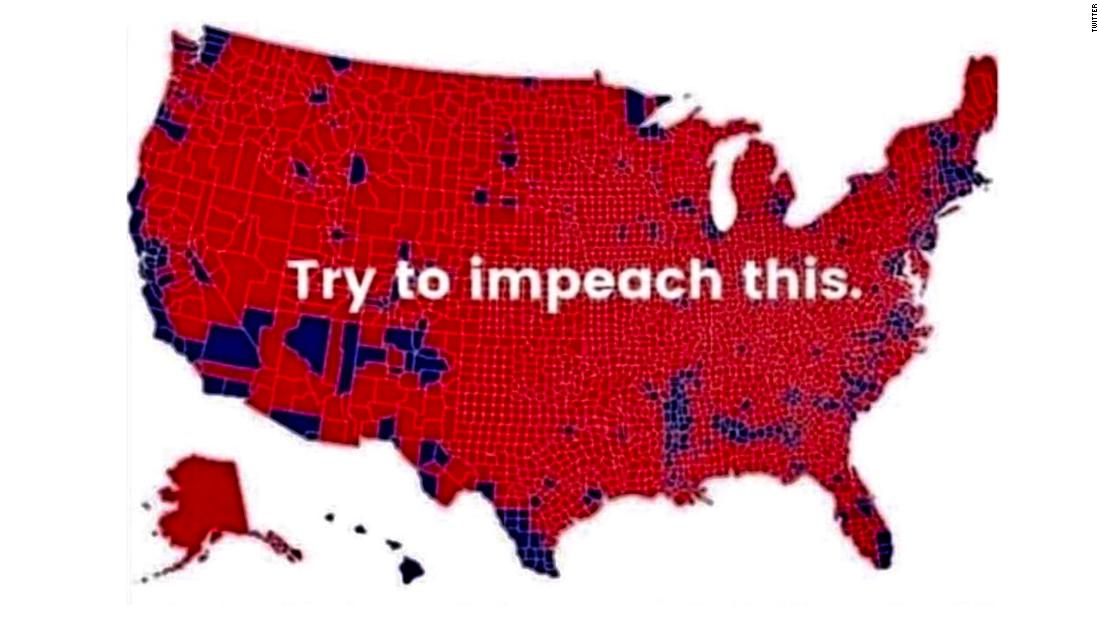
(CNN)On Tuesday morning, President Donald Trump tweeted a 2016 map with the words “Try to impeach this” written across it.
The map — in case you can’t tell — is meant to be a county-by-county rendering of the 2016 election. Upon closer inspection, the map turned out to have several mistakes in it — but its overall point is accurate, as far as it goes. Trump won 2,626 counties to Hillary Clinton’s 487 in the last presidential election, according to the Associated Press.
But the map is also quite misleading.
Why? Simple: What it shows is that Trump won more landmass than Clinton, which isn’t all that revealing. Lots and lots of those red counties have tiny populations — a fact you wouldn’t know by simply looking at that sea of red.
Remember that Clinton won the popular vote against Trump by more than 2.8 million votes. That’s a far larger margin than the 543,000 more votes that Al Gore got than George W. Bush in 2000 even while losing the Electoral College.
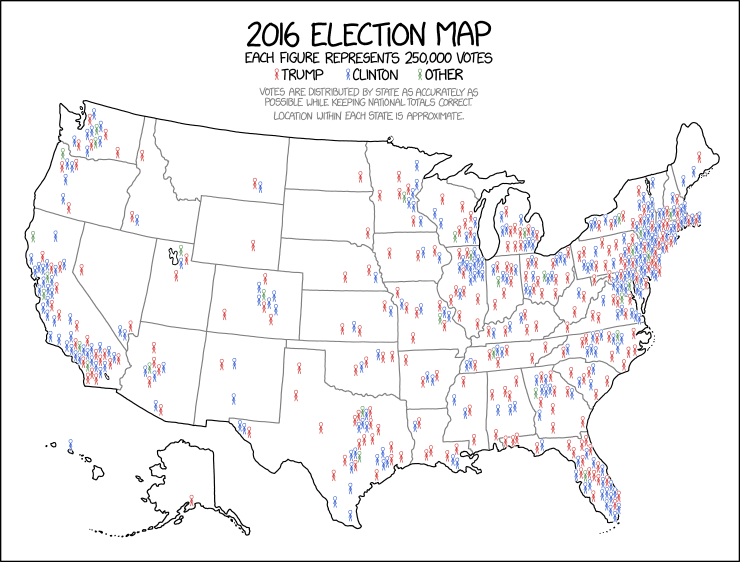
Which is why, when you allow for actual population in the country, the map looks a lot different. This one, by cartoonist Randall Munroe on his XKCD website, is a much more accurate depiction of what the 2016 election actually looked like.
What Trump is trying to show in his tweeted map is that all of America — or at least most of it — voted for him. What any closer examination of his map reveals, though, is something we already knew: Lots and lots of people live on the east and west coasts and tend to favor Democrats, while fewer people live in the interior of the country but tend to be more supportive of Republicans.
So, the image Trump tweeted is deeply misleading about what the 2016 election meant — and who voted for him. But the text Trump (or someone else) laid onto the map is also, well, not right.
“Try to impeach this” is obviously a dare based on the image, which purports to show just how much support this President had in 2016. But impeachment has zero to do with how popular (or not) a President is or was.
Article II, Section 4 of the Constitution sets this bar for impeachment:
“The President, Vice President and all civil officers of the United States, shall be removed from office on impeachment for, and conviction of, treason, bribery, or other high crimes and misdemeanors.”
Nowhere in that is the word “popular” mentioned. Nor is “won a lot more counties in 2016” referenced.
Trump doesn’t seem to get that. He has repeatedly expressed sentiments similar to the one on this map as he gears up to run for a second term. Over the weekend, Trump tweeted this:
“How do you impeach a President who has created the greatest Economy in the history of our Country, entirely rebuilt our Military into the most powerful it has ever been, Cut Record Taxes & Regulations, fixed the VA & gotten Choice for our Vets (after 45 years), & so much more?”
Whether that is a willful misunderstanding or whether Trump plain doesn’t get why a president can be impeached is up for debate — and hard to know.
But let’s be clear: The map the President tweeted on Tuesday morning presents a deeply misleading image of the 2016 electorate and shows a fundamental misread of the reasons presidents get impeached.
UPDATE: This story has been updated with CNN’s fact check that found inaccuracies in the image of the map Trump tweeted.
Read more: https://www.cnn.com/2019/10/01/politics/donald-trump-map-2016-election/index.html


